Specification
The Specification page is used to create and edit reports. In contrast to the Quick Edit Strip and the Properties page which alter the appearance of reports, the Specification page defines the data model behind a report. That is, it defines what job data the cross-tabulation engine processes and the overall structure of how it appears in a report.
In brief, a minimal valid specification can be created by selecting variables and functions from the three trees available on the left (Variables, Axes and Functions) then clicking the right-arrow buttons to send the selections to the top and side trees. Clicking Run will then run cross-tabulation and generate a report.
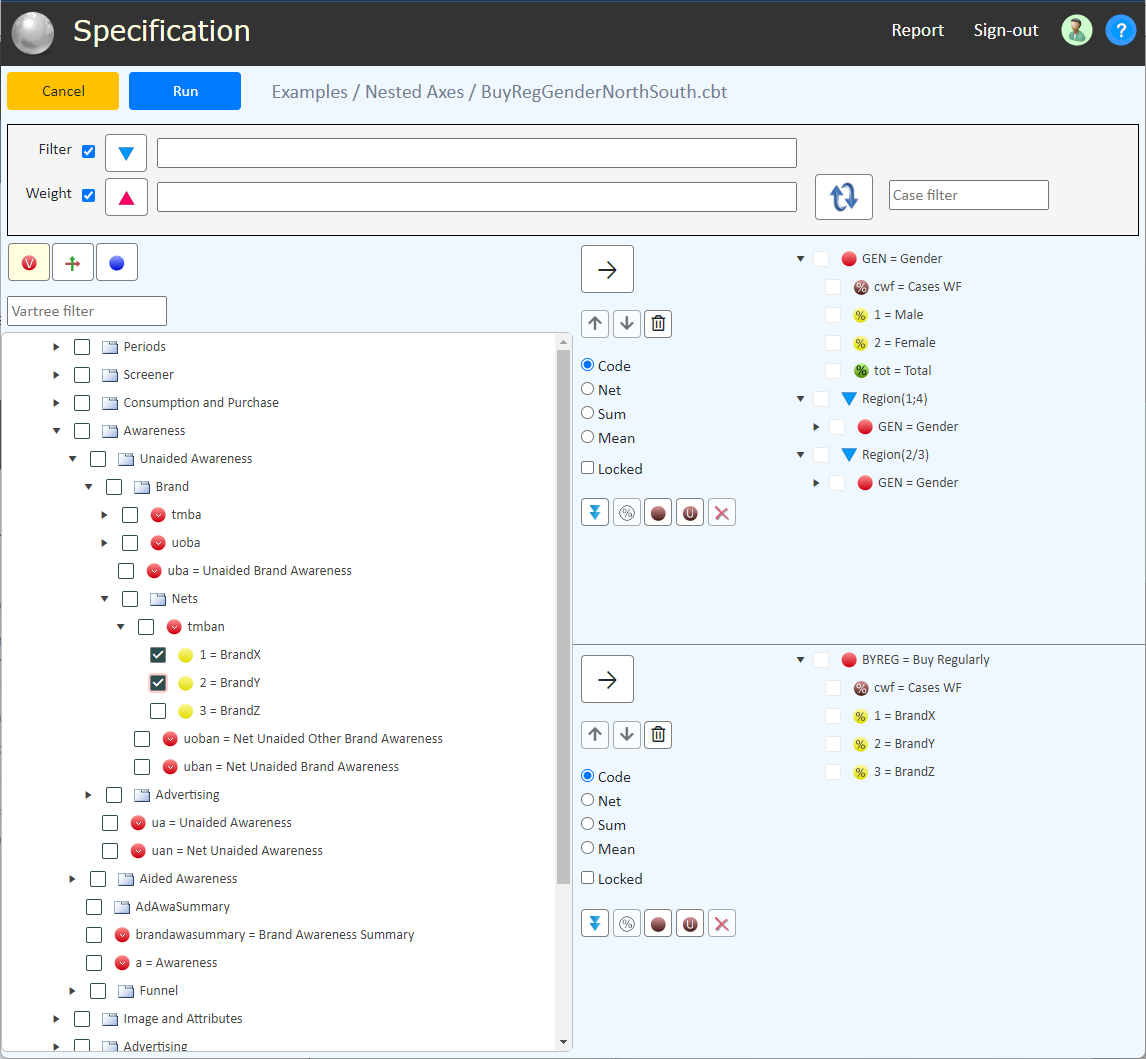
The following screenshot shows a typical report specification page, which is followed by a description of the various sparts of the page.

Report specification page
Cancel
Discards the specification and returns to the Report page. Any previously selected report will be redisplayed on return to the Report page.
Run
Runs cross-tabulation processing using the data and options selected in the Specification page, then returns to the Report page to display the resulting report. Note the reports with large numbers of variables are computationally intensive and may take minutes to run. A busy spinner is displayed while the report is being generated.
Filter

An optional filter expressions to be applied to the report. The expression can be typed directly into the text area, or it can be composed from variables, codes and functions.
Typing filter expressions directly will be convenient for skilled users, but there is the risk of typing spelling or syntax errors. A slightly slower but more reliable way of composing filters is to select (check) variables or codes in the variable tree and functions in the function tree, then click the blue triangle button to append the selection to the filter expression.
The filter checkbox is used to quickly turn the filter on and off while preserving the filter expression in the report.
Weight

An optional weight expression to be applied to the report. The expression can be typed directly into the text area, or it can be composed from variables.
Typing weight expressions directly will be convenient for skilled users, but there is the risk of typing spelling or syntax errors. A slightly slower but more reliable way of composing filters is to select (check) variables in the variable tree, then click the red triangle button to append the selection to the weight expression.
The weight checkbox is used to quickly turn the weighting on and off while preserving the weight expresion in the report.
Table / Chart

Toggles the report format between tabular (workbook sheet) format and chart format. Note that charts are not supported in the current version of Silver and reports will always display in table format. Support for charts is proposed for inclusion in a future Silver release.
Swap

Swaps (flips) the top and side specifications.
Variable Trees
The left of the specification page contains three trees named Variables, Axes and Functions which can be viewed one-at-a-time by clicking the following corresponding buttons from left to right.

Report specification page
If valid nodes in the three trees are checked then the right-arrow buttons become enabled so the selection can be sent to the top or side. It is the process of selecting nodes from the trees on the left and sending them to the top and side that builds a valid specification.

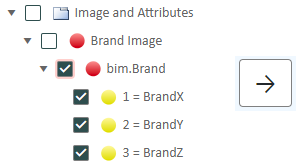
Select and send
 For performance reasons, the variable tree does not pre-load all of the codes (yellow nodes) under
the variable and codeframes (red nodes). There can potentially be many thousands of code nodes,
and such cases, preloading them could severly degrade performance or even cause a crash due to resource exhaustion.
For this reason the codes are loaded on demand.
Mouse clicking on a variable or codeframe node will cause the child code nodes to be loaded and expanded into view.
In the screenshot of a Specification page at the top of this topic it can be seen that the Marital Status node has been clicked and its child code nodes have been loaded and expanded.
When the Functions tree is selected, a set of extra command button become available to create and edit cuntions. This feature is described in the Function Editor section later in this topic.
Top / Side Trees
As explained in the Variable Trees section, a report specification is built by sending variables and codes to the top and side trees. A report is generated by processing the top and side trees through the cross-tabulation engine.
The panels containing the top and side trees are identical, so the contents of this topic apply to both.
Send button
Sends (appends) the current selection in one of the variables trees to the top or side tree.
Move Up/Down buttons
Moves the currently selected nodes up and down while preserving their level in the tree. The buttons are only enabled when a movable selection is made.
Drop mode radio buttons
The mode selection specifies optional arithmetic functions to applied to codes that are sent to the top or side.
Code — Default mode is to not apply any functions.
Net — Net multiple codes from one variable.
Sum — Sum multiple codes from one variable.
Mean — Average (mean) multiple codes from one variable.
Tree command buttons
Nest — ?
TODO describe Nest properly
Percent — Toggles percentages on the currently selected codes.
Base — ?
TODO describe Base properly
Delete — Deletes the currently selected nodes and all their child nodes.
Function Editor
TODO describe the function editor

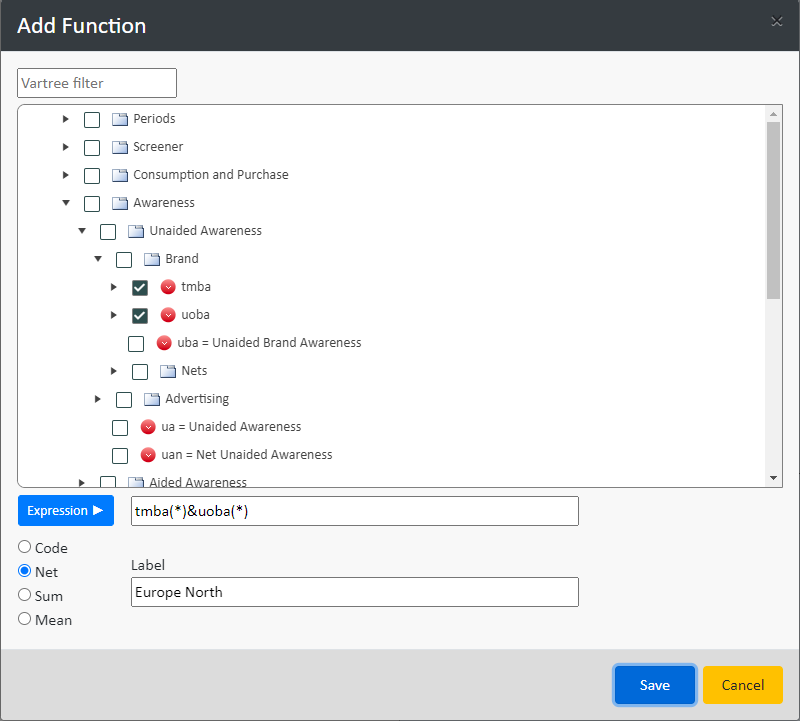
Function edit buttons

Function editor
