Dashboards
A Dashboard is an Excel™ workbook that is formatted using a set of conventions defined by Red Centre Software. The conventions specify how the filtered output of one or more Ruby reports is merged into cells into the workbook, thereby updating any formulas or charts that are include those cells. The result is an interactive dashboard that is designed to display large amounts of data in a compact and attractive readable format.
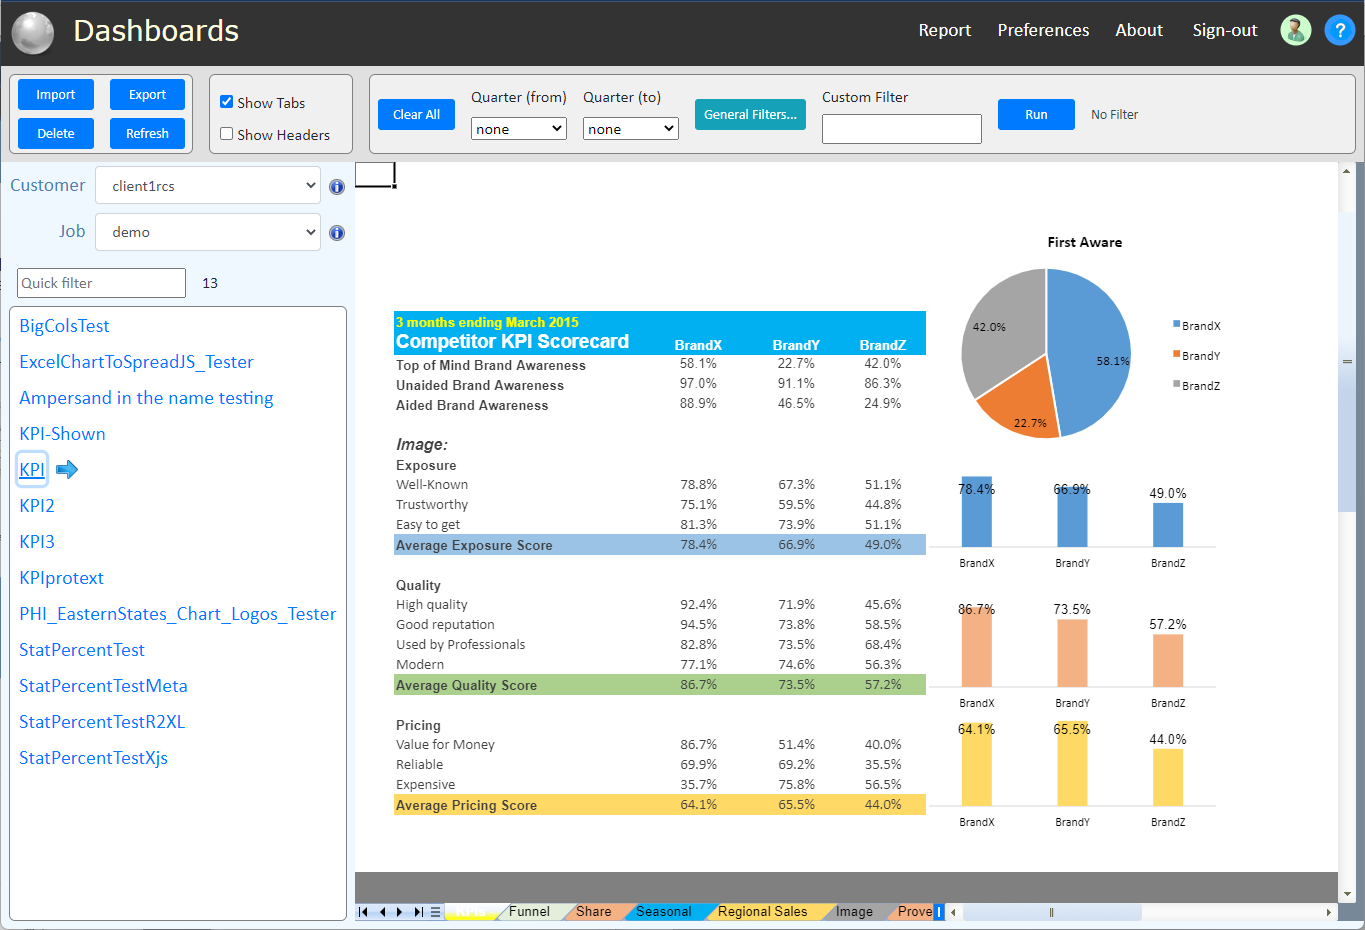
The following screenshot shows a typical Silver dashboard page. The various parts of the page are described in detail later sections of this help topic. In summary though, the Excel workbook the defines the dashboard is displayed in the main right side area of the page. The dashboard can contain any sheets, formulas, formatting and charts that are valid in an Excel workbook. Above the dashboard is a strip of drop-down filter selectors that can be combined in any desired way to filter the data displayed in the dashboard.

Dashboard page
Commands are available to import and export dashboards between Silver storage and a local computer. Dashboards can therefore easily be composed and edited in Microsoft Excel on the desktop, then imported into Silver for distribution.
An Excel workbook that follows the dashboard design conventions is usable across the suite of the Red Centre Software products.
TODO continue overview of dashboards. Either include or link to documentation on how to compose a compliant dashboard in Excel.
Customer/Job Selection
Silver stores dashboards in a hierarchical structure with customers at the highest level, then jobs within each customer. Customers and jobs help organise dashboards into high-level groups that correspond to real-world business structures.
Use the drop-down selectors to choose the customer and job combination containing the desired dashboards. Selecting a customer causes the job list to fill with a list of jobs owned by the customer.

Dashboard customer/job select
Dashboard List
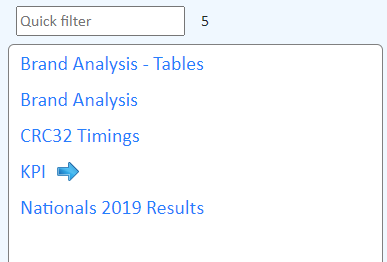
Silver displays a scrolling list of dashboards that are associated with each job. Clicking an item in the list will display the dashboard in the main workbook area on the right side of the page. A small arrow next to an item indicates it is the currently loaded dashboard. If no dashboards are associated with a job then the dashboard list is disabled and displays the message "The job does not contain any dashboards". In case case it's always possible to use the Import command to add dashboards to the job.

Dashboard table of contents
Dashboard Search
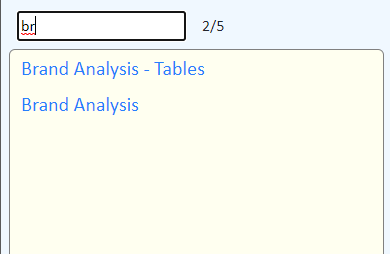
Silver provides a dashboard list search feature to assist locating specific dashboards which may otherwise be difficult to find in a large list. As a string of text is typed into the search text box abover the dashboard list, the list is filtered down to those items that contain the search text anywhere in the their name. A dashboard in the search result list can be clicked to load the dashboard. The search result list has a light-yellow background colour as a visual reminder that a search is active

Dashboard table of contents in search mode
Commands
The top-left group of command buttons perform functions that manage dashboards.

Dashboard command buttons
Import
Displays a pop-up window from which files can be selected to build an import list. Click Chose Files to display a "file open" selector which accepts files with the *.xlsx extension. As one of more files are selected, they accumulate in the list. When the list is complete, click the Import button to upload all of the files to Silver data storage where they will become dashboards associated with the current job.

Dashboard import
The appearance of the "file open" prompt may vary depending upon the web browser and host operating system. Security policies may restict how files can be selected. In Windows™ for example, files can only be opened from the My Documents folder for the currently signed-in user account.
 Note that it's possible to upload any Excel workbook files, even ones that do not following the dashboard design conventions.
Non-dashboard workbooks will be listed in the dashboard list, but when they are selected, Silver recognises they are not valid
dashboards and simply displays them as-is and no controls are available for filtering. This
may be an acceptable way of displaying static data that does not to be subject to interactive filtering.
Export
Issues a JavaScript request to the web browser to download a copy of the currently dashboard to the local computer. Download processing may vary depending upon the web browser and the host operating system and what security policies are applicable. In Windows for example, the dashboard file can only be saved to the My Documents folder of the currently signed-in user account. Different browsers may display the results of file download processing in different ways.
Delete
Deletes the currently selected dashboard from the current job. The web browser issues a confirmation prompt via a JavaScript confirm. The dashboard is deleted from Silver data storage and can only be recovered by importing a new copy.
Refresh
Refreshes the dashboard list from the Silver data store. This can be useful to display dashboard list changes made by other users working in the same job.
Workbook Options
The second group of controls in the dashboard header strip control the appearance of dashboard workbooks.

Dashboard workbook options
Show Tabs
Toggles the display of sheet tabs at the bottom of the workbook. The selection remains active for the Silver sign-in session.
Show Headers
Toggles the display of sheet row and column heads. The selection remains active for the Silver sign-in session.
Filter Strip
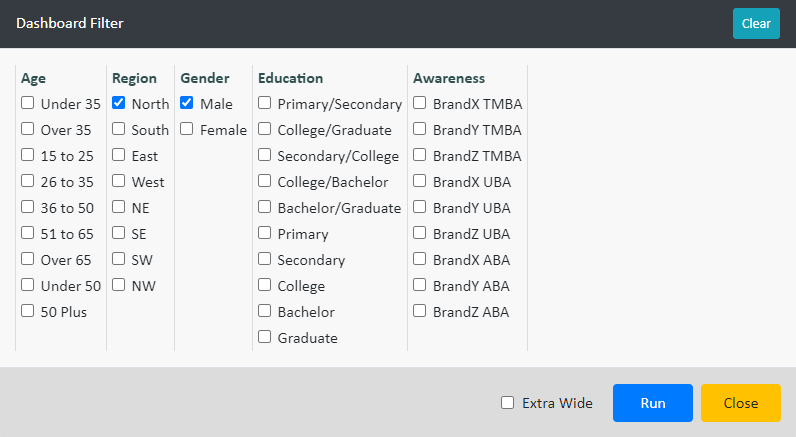
Dashboard workbooks that follow design conventions will normally define a set of filter variables associated with data in the dashboard. It is the application of filters to dashboards that makes them so powerful as interactive displays. The following screenshot shows a typical strip of dashboard filter variables. The number of filters and their labels is defined by the author of the dashboard. By repeatedly changing the filters and clicking Run it's possible to explore data and look for trends, patterns and anomalies.
If a dashboard contains charts linked to filtered cell values, then the charts will update in response to filtering and create a rich interactive experience.
The Clear button provides a quick of resetting all filters back to their default unfiltered selections.

Dashboard filter controls

Dashboard general filter
Workbook
TODO describe the dashboard workbook
