Reports
This topic describes the groups of controls that compose the Report page.
Customer/Job Selection
Cadmium stores its reports and data in a hierarchical structure with customers at the highest level, then jobs within each customer. Customers and jobs help organise reports into high-level groups that correspond to real-world business structures.
Use the drop-down selectors to choose the customer and job combination containing the desired reports and data. Selecting a customer causes the job list to fill with a list of jobs owned by the customer.
Upon arrival at the Reports page, Cadmium attempts to re-select the customer and job that were most recently selected. If there was no previous selection, then the first items are selected.
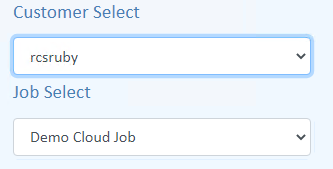
Customer/Job select
The list of which customers and jobs are available is controlled by licensing rules associated with sign-in credentials. The licensing rules can be adjusted by Red Centre Software or your Cadmium support representative.
A User Preference controls if the customer and job lists are sorted alphabetically, or they are unsorted and appear in the order they were created.
TOC (Table of Contents)
A customer and job must be selected to begin working with Cadmium reports. To further help organise reports, each job contains a single TOC (table of contents) where reports are organised into a navigation tree structure of the type that is familiar on modern PC operating systems.
The TOC root nodes always contain a node that corresponds to the currently signed-in user account. There may be other root nodes named for other users who have made their reports public and shared. Other special global root nodes such as Exec may be present.
Open the user and folder nodes to display reports nodes which are identified by the icons
 and
and
 which correspond to tables and charts respectively. Click a report node to display the report in theworkbook area
on the right side of the page. The currently selected report in the TOC is indicated by a highlight background colour.
which correspond to tables and charts respectively. Click a report node to display the report in theworkbook area
on the right side of the page. The currently selected report in the TOC is indicated by a highlight background colour.
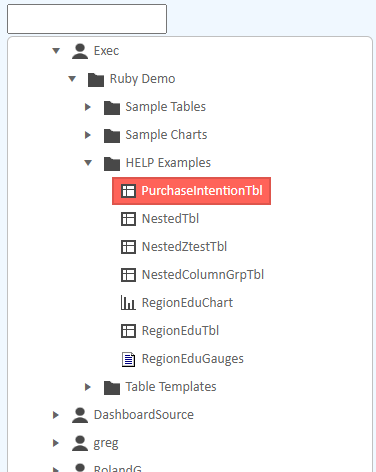
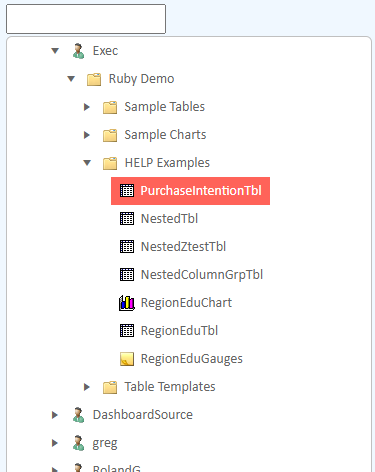
The following screenshot shows an example TOC with two special root nodes named Exec and DashboardSource at the top, followed by nodes for different user accounts. The side-by-side TOCs show the appearance when modern flat icons are used (left) and when legacy Laser-style icons are used (right). The choice of icons can be made in the Preferences page.
|
|
| TOC with modern icons | TOC with legacy icons |
TOC Search
Cadmium provides a TOC search feature to assist locating specific reports which may be otherwise difficult to find in large numbers of tree branches and nodes.
As a string of text is typed into the search text box above the TOC, the tree is replaced by a flat list of report names which contain the search text anywhere in their names (the matching is case insensitive). This list updates instantly as the search text is changed, Show H
The search result list has a light-yellow background colour as a visual reminder that a search is active and the TOC tree is temporarily hidden.
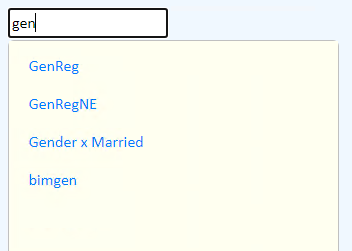
Toc in search mode
Command Strip
The top left of the Report page contains a strip of command buttons which perform functions related to whole reports.

Report command strip
New
Opens the Specification page with an empty report specification.
Edit Spec
Opens the Specification page displaying the specification of the currently selected report. This button is only enabled if an existing report is selected.
Properties
Opens the Properties page displaying the properties of the currently selected report. This button is only enabled if an existing report is selected.
Save (as)
Displays a pop-up window that provides the ability to save the currently loaded report.
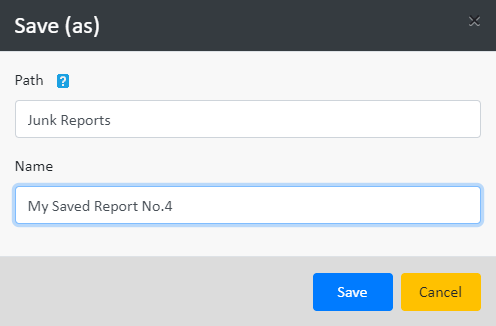
Report save (as) prompt
A save Name is required. A Path is optional. If the Path is blank then the report is saved directly under the account node. The following picture illustrates how a Path can be multi-part where the path parts are separated by either a forward slash (/) or back slash (\). The Path and Name are combined to specify where the saved report will be placed in the TOC tree relative to the current user’s account node.
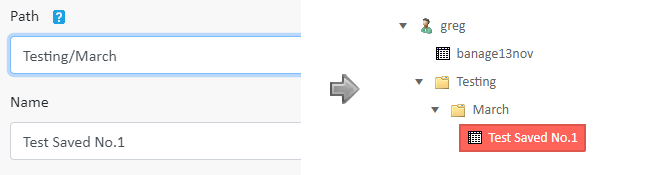
Report save (as) with Path and Name
A saved report will overwrite any existing report with the same Path and Name.
Download
The Excel™ icon is a hyperlink to the remote XLSX document that is the source of the currently loaded report. Clicking the icon causes the web browser to launch the linked file. Exactly what happens when a link is launched depends upon the web browser configuration and file associations.
By default, the Excel application is associated with the XLSX file extension and the web browser will download the file and display a prompt to open it. This default behaviour can be overridden or blocked by security settings in the browser or the operating system.
Web browsers normally support the alternative of right mouse clicking the icon link to display a pop-up context menu which may contain an option like “Save as” or “Save link as” which provides a way to save the XLSX file to a local folder where it can be opened manually.
Quick Edit Strip
The quick edit strip is only visible when a report is loaded. The controls in the strip allow quick application of the most common repetitive commands that alter the appearance and filtering of a report.

Report quick edit strip
Note that the Apply, Undo, Redo, Clear and Delete buttons can appear as smaller square buttons containing icons, or they can appear as wider buttons containing text labels. The appearance can be specified in the Preferences page.
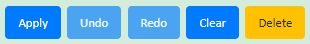
Report quick edit large buttons
Freq
Toggle frequency bands. Click Apply to refresh the report.
Col%
Toggle column percent bands. Click Apply to refresh the report.
Row%
Toggle row percent bands. Click Apply to refresh the report.
Sig
Toggle significance display. Click Apply to refresh the report.
Drill Filter
A drop-down pick list of drill filters applicable to reports in the currently selected job. By default, selecting a drill filter applies it immediately without the need to click the Apply button. This behaviour can be changed in the User Preferences page.
Apply
After changing the Freq, Col%, Row% or Sig filters it is necessary to click the Apply button to refresh the report display with the changes applied.
Undo
If the Undo button is enabled you can click it to undo (remove) the most recently applied drill filter and immediately refresh the report. The button will disable when all drill filters have been undone.
Redo
If the Redo button is enable to can click it to redo (add) the most recently undone drill filter and immediately refresh the report. The button will disable when all drill filters have been redone.
Clear
Clears all quick edit strip values back to the original values defined in the report and restores the report to its original appearance.
Delete
The Delete button is only visible when the currently loaded report is under the TOC branch that is owned by the currently signed-in account. That is, a user can only delete reports that they own. The web browser will display a confirmation prompt before a report is deleted.
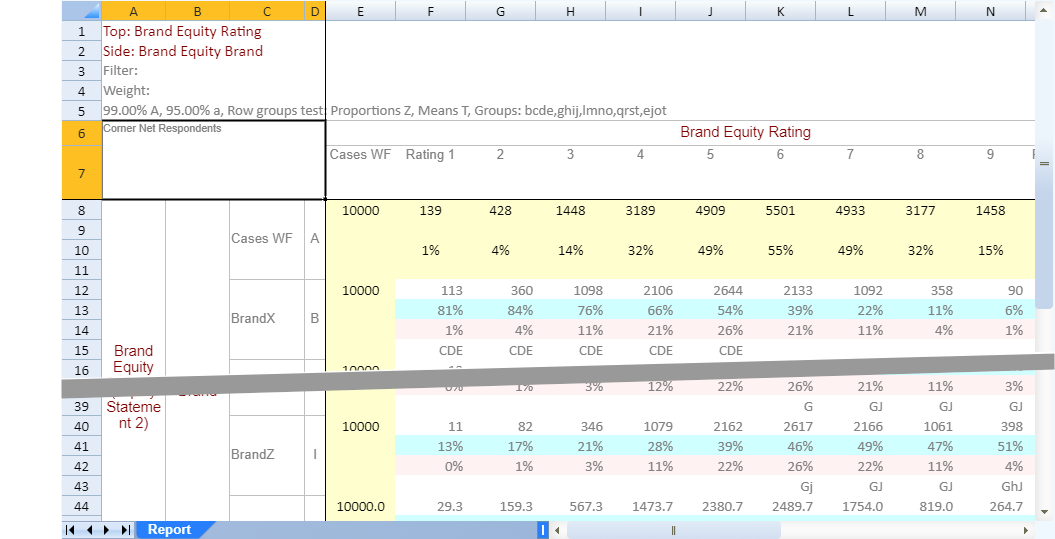
Row / Column Freeze
These toggles freeze the rows or columns from the position of the currently selected workbook cell. The following screenshot shows how the merged cell B8 has been selected for row and column freeze, and black lines to the right and bottom of the selection indicate the frozen areas.
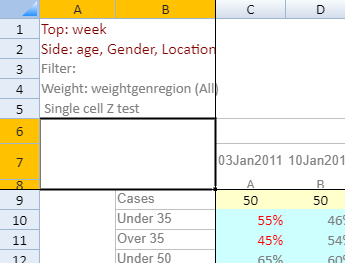
Row/Column freeze
The freeze selection is only applied to the currently loaded report.
Show Headers
Toggles the appearance of headers to the left and top of the workbook. The selection remains active for all reports in the currently loaded job.
Report Workbook
Cadmium displays Ruby reports in a component that is carefully designed to mimic the appearance and functionality of a real Microsoft Excel workbook. Cells can be selected, columns and rows can be resized and formulas and data can be entered into cells.
The following screenshot (middle omitted) shows the layout of a typical report workbook.
Report workbook
The column and row headers of a workbook sheet are visible by default. Use the Show Headers checkbox in the Quick Edit Strip to toggle the visibility of the headers.
A detailed description of a Ruby report is currently beyond the scope of this document. Ruby reports have identical structure and contents in all products in the Red Centre Software suite.
 The component that displays reports in an Excel workbook format supports direct editing of cells and
the entry of formulas into cells. See the following external help pages at grapecity.com
for more detailed information on formulas.
The component that displays reports in an Excel workbook format supports direct editing of cells and
the entry of formulas into cells. See the following external help pages at grapecity.com
for more detailed information on formulas.